Ensemble Forecasting With AdaptiveHedge Part 2. How AdaptiveHedge improves forecast accuracy
Overview
In part 1. we saw how AdaptiveHedge can be used as part of an automated forecasting system.
This follow up article will first demonstrate the improvement in forecasting accuracy that
AdaptiveHedge can make on a non-ensembling method like FollowTheLeader in section 1, before going
through exactly how this improvement is achieved in section 2.
1. Testing performance on benchmark data
M3 competition benchmark data
The international institute of forecasters holds the yearly M3 forecasting competition using a benchmark dataset. We can use an extract of this benchmark data to test the performance of adaptiveHedge and FollowTheLeader. In this analysis 72 4-month forecasts over a 7 year period for 197 different time-series have been produced for each of the two model selection algorithms giving us 28368 forecasts in our analysis.
Error results
In table 2.1 we can see that AdaptiveHedge produces forecasts that are on average 4.49% more accurate than FollowTheLeader on the benchmark dataset. It also shows that the forecasts produced have a 10.05% lower variance indicating that AdaptiveHedge forecasts are more stable than that of FollowTheLeader as well as more accurate.
| FollowTheLeader ($M) | AdaptiveHedge ($M) | Difference ($M) | Difference (%) | |
|---|---|---|---|---|
| Error Mean | 2.59 | 2.47 | 0.12 | 4.49 |
| Error Variance | 5373.92 | 4833.19 | 539.74 | 10.05 |
It should be noted that these results averages and that their are many forecasts where FollowTheLeader performs better as can be seen from figure 2.1.1 showing the distribution of the error differences of forecasts between the two model selection algorithms.
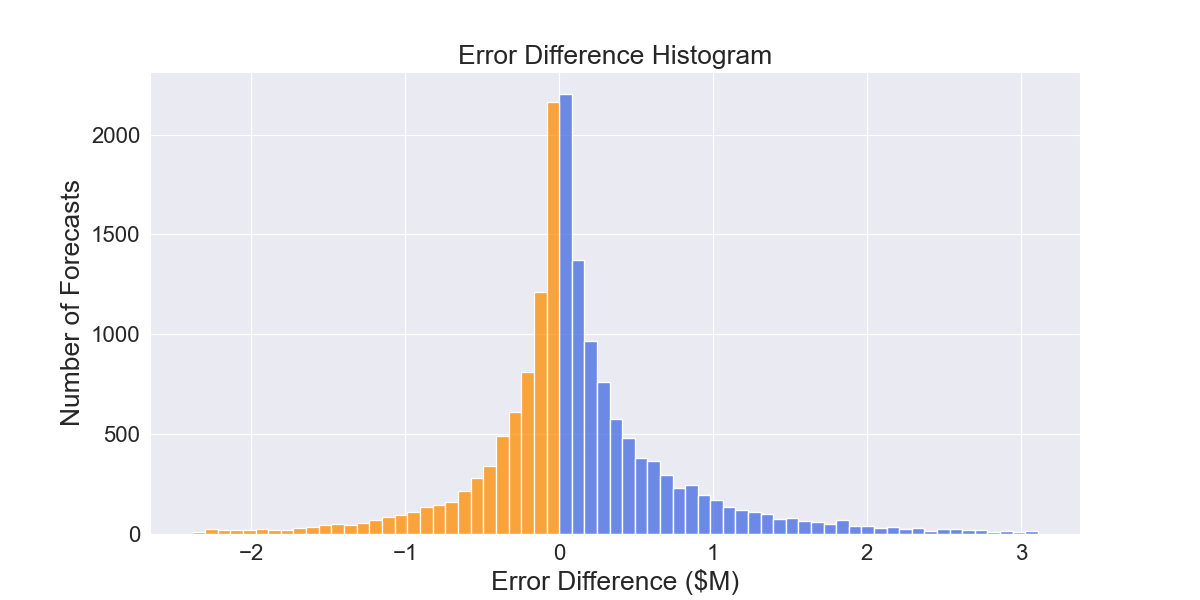
Fig 2.1.1 AdaptiveHedge vs FollowTheLeader error difference distribution. Blue indicates forecasts where AdaptiveHedge has lower error, while orange indicates FollowTheLeader has lower error
As we can see, AdaptiveHedge has lower forecast error more often than not and that the error reduction in these instances is typically larger than the instances where FollowTheLeader has a lower forecast error.
Statistical analysis of performance difference
In a practical case, results like those above could be used as evidence to adopt AdaptiveHedge as the model selection algorithm used in an automated forecasting system. In doing so, an implicit inference would be being made i.e. that the performance difference observed past observations is going to continue into the future.
Confidence interval estimation or hypothesis testing could enable the assessment of the validity of that inference. However, using parametric tests would risk type I error due to the non-independence of our error observations, as is the case with nearly all time series datasets. This can be observed by looking at the error observations over time. If the error observations were independent they would look like a “white-noise” time-series i.e. errors would be normally distributed around a fixed mean. As can be seen Figure 2.2.1, this is clearly not the case.
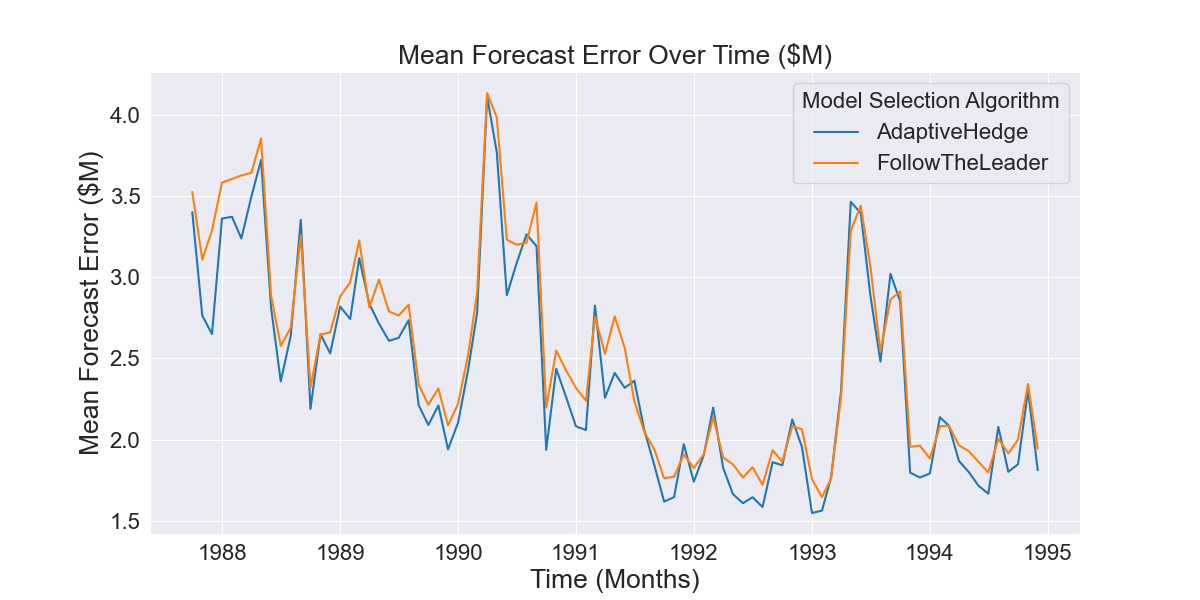
Fig 2.1.2 Mean error of AdaptiveHedge vs FollowTheLeader forecasts over time
Instead, validation requires a further nested level of time-series cross-validation which is beyond the scope of this article. For now however, it is sufficient to observe that figure 2.1.2 shows AdaptiveHedge’s error generally stays lower than FollowTheLeader’s over a long period and it is therefor not unreasonable to assume this will continue.
2. How AdaptiveHedge outperforms FollowTheLeader
Theory of how AdaptiveHedge outperforms FollowTheLeader
We can understand how AdaptiveHedge outperforms FollowTheLeader using the bias-variance trade off framework. To help with this, it is important to realise that adaptiveHedge and FollowTheLeader are being trained on in-sample data, i.e. historical performance data, to make an out-of-sample prediction, i.e. a forecast.
The difference between the two algorithms is how much differences in the in-sample, historical perfomance data effects their out of sample predictions. FollowTheLeader has the high sensitivity to the in-sample data, in that even a minor change to the historical performance of the primitive models can lead to a dramatically different forecast if the change leads to a different model having the lowest overall error. Comparatively in the case of AdaptiveHedge, the same change would only lead to a minor difference in the calculated weights resulting in a relatively small shift in the forecast produced.
As a result of this lower sensitivity, FollowTheLeader has higher model-variance than FollowTheLeader and as a result poor forecasts when the best performing model in the in sample period does not perform well out of sample. In these instances, FollowTheLeader overfits the training data and generalises poorly whereas AdaptiveHedge avoids this error by including the models that perform well in the out of sample period, despite their performance in the in-sample period.
Example of how AdaptiveHedge outperforms FollowTheLeader
We can gain further intuition of how AdaptiveHedge outperforms FollowTheLeader by looking at the following example. Fig 2.2.1 shows primitive model forecasts (prior to model selection) where the ARIMA (1,0,0) primitive model performs poorly. However, we can see in Fig 2.2.2 and Fig 2.2.3 that this model’s forecasts actually have the lowest historical error.
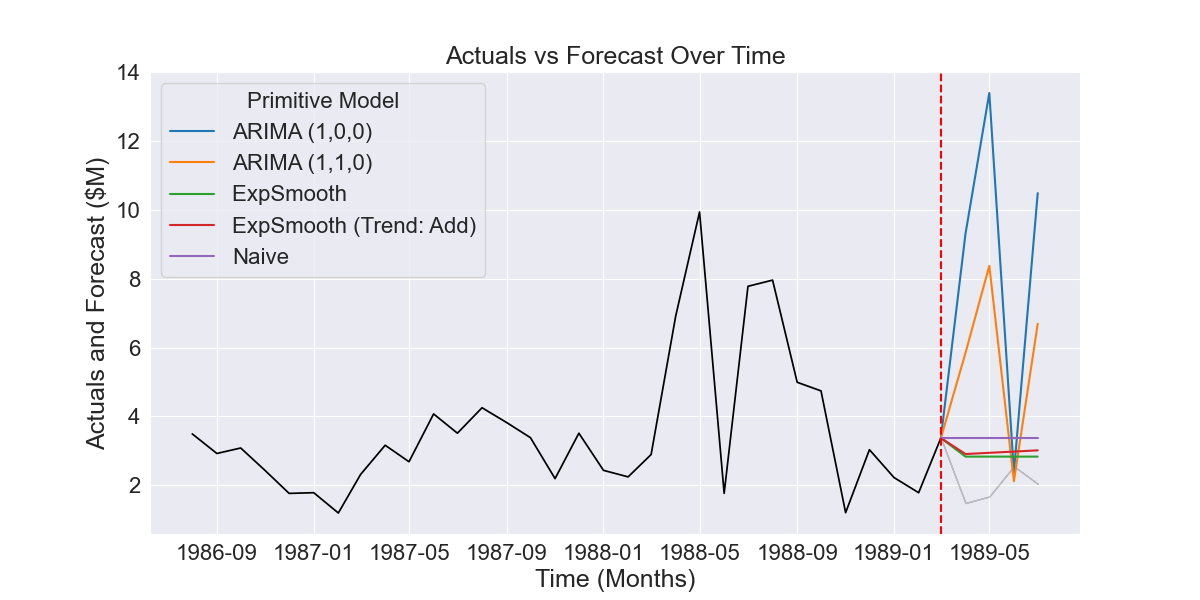
Fig 2.2.1 Example of five forecasts produced by different time series models
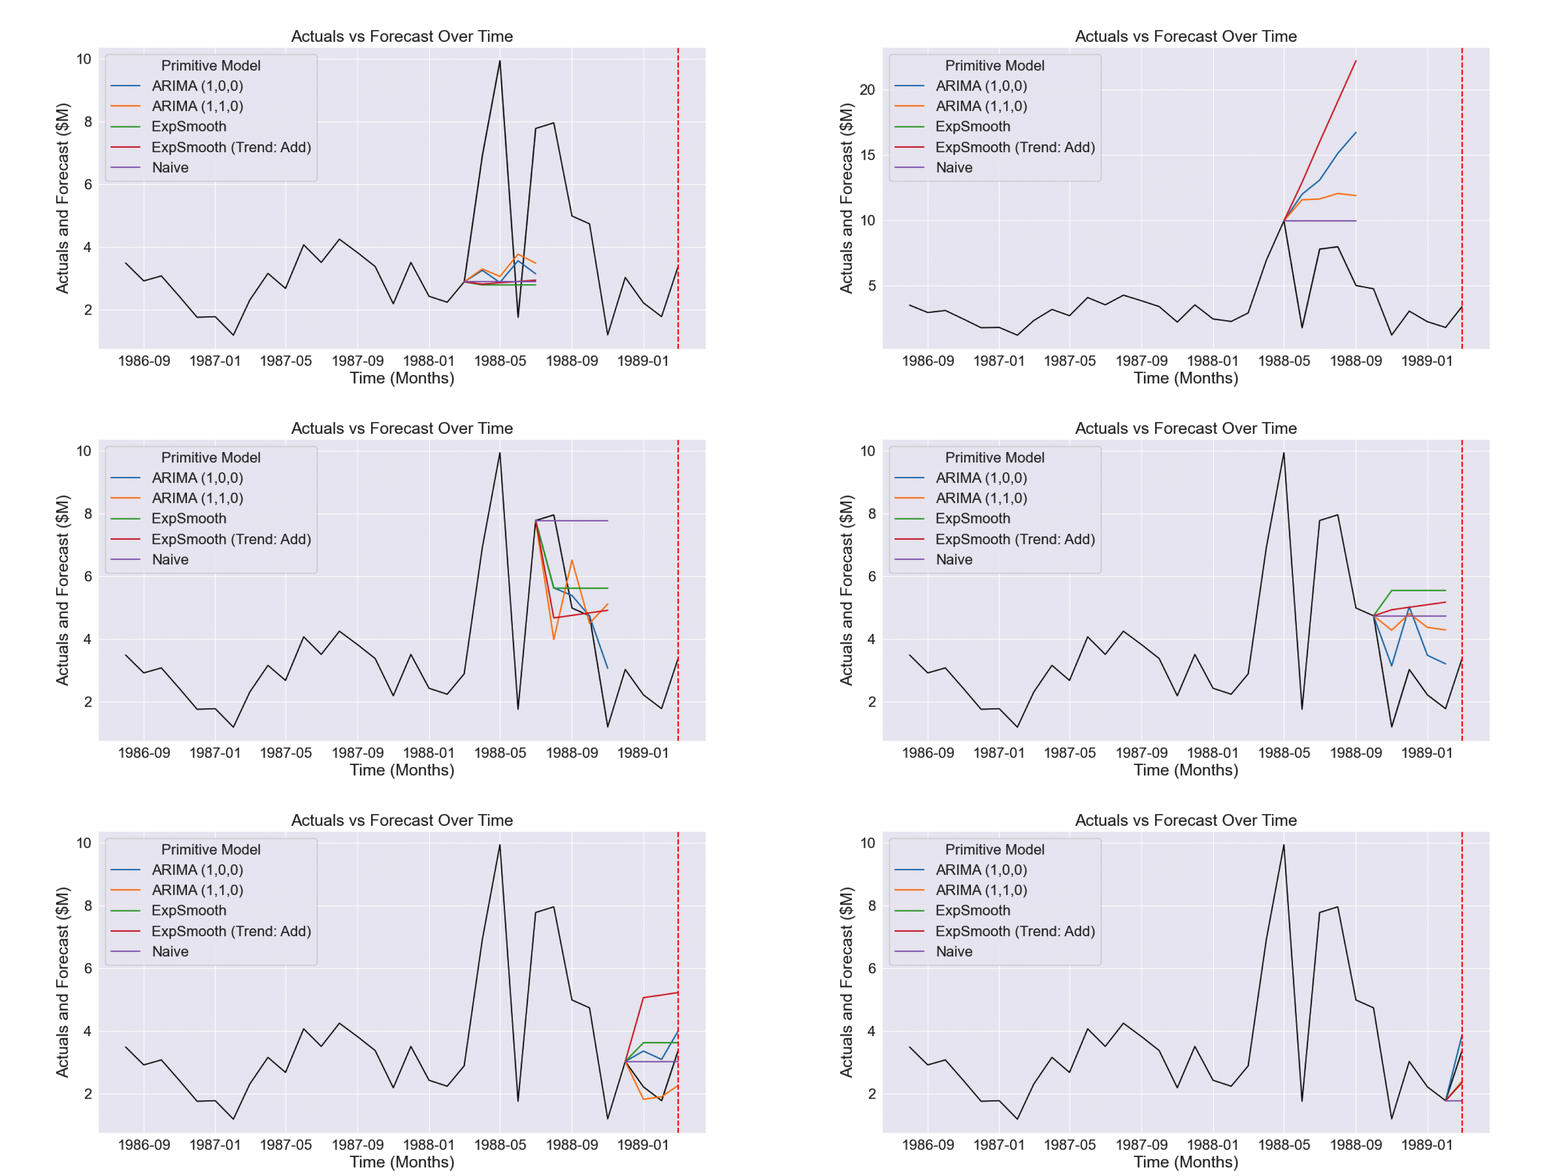
Fig 2.2.2 Historical forecasts prior to forecast shown in Fig 2.2.1
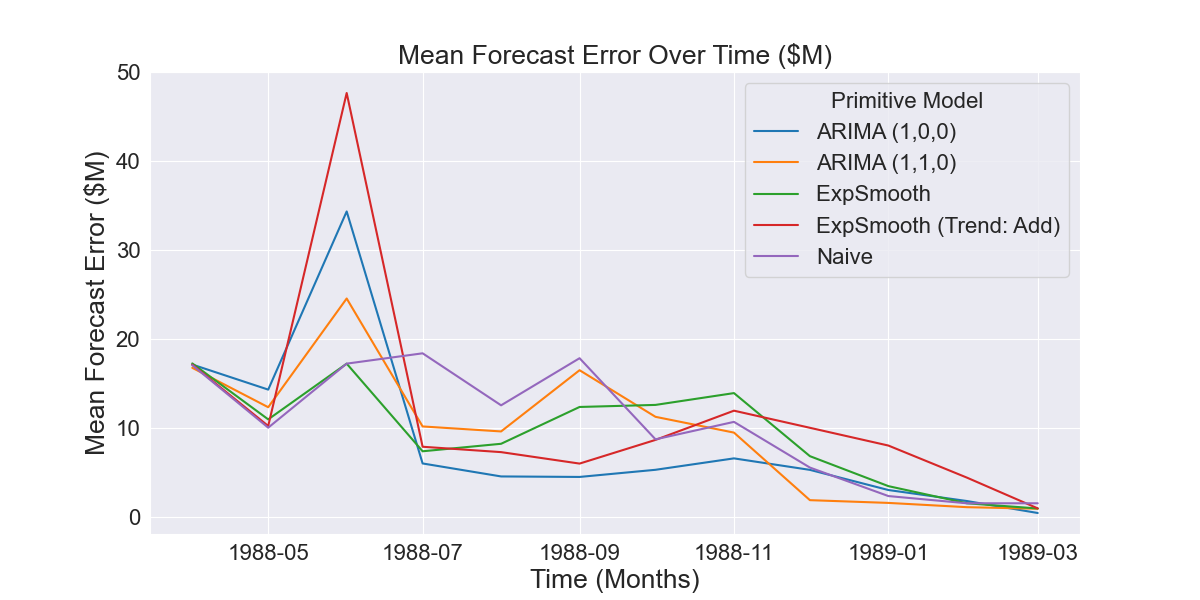
Fig 2.2.3 Aggregated error of historical forecasts shown in Fig 2.2.2
This is an especially bad instance of where the best performing model in-sample does not continue to perform well out-of-sample. As we can see in Fig 2.2.4, FollowTheLeader overfits to this in-sample data and calculates the ARIMA (1,0,0) model weight to be 1 and all other model weights to be 0. Fig 2.2.5 shows AdaptiveHedge avoiding this mistake by giving some weight to the Naive and Exponential Smoothing models that will perform well out of sample, despite their worse performance in-sample as seen in Fig 2.2.2 and Fig 2.2.3.
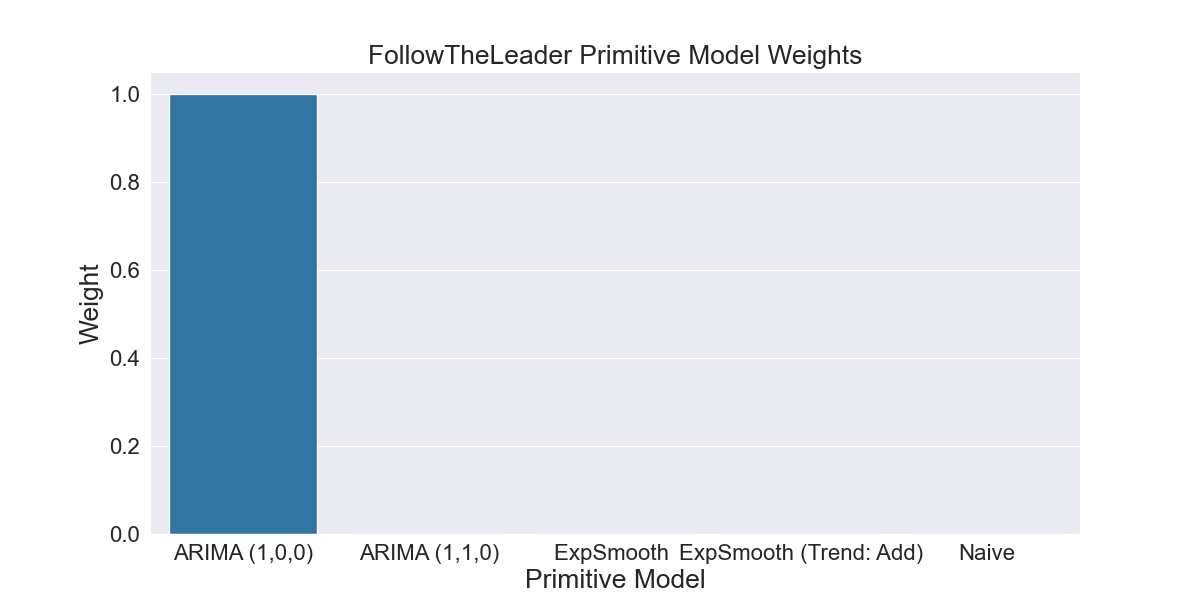
2.2.4 Weights calculated by FollowTheLeader based on primitive model error shown in Fig 2.2.3
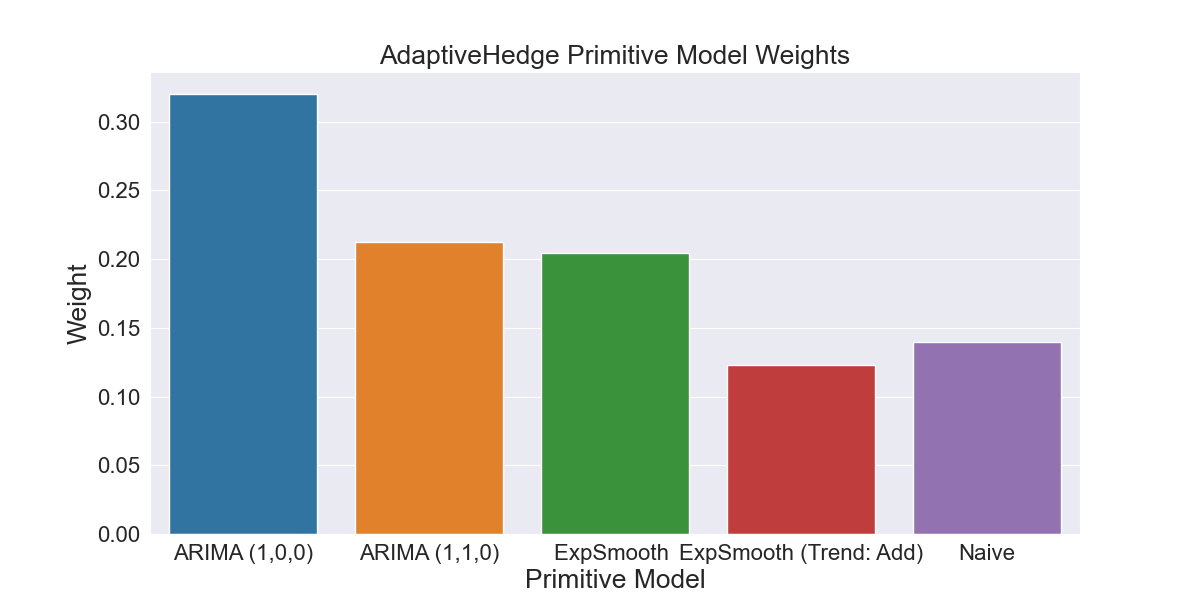
Fig 2.2.5 Weights calculated by AdaptiveHedge based on primitive model error shown in Fig 2.2.3
Finally, we can see the difference this makes to the error of the forecasts this produces in Fig 2.2.6. Although AdaptiveHedge still makes an inaccurate forecast, the accuracy of the forecast has been much reduced by the inclusion of models other than ARIMA (1,0,0).
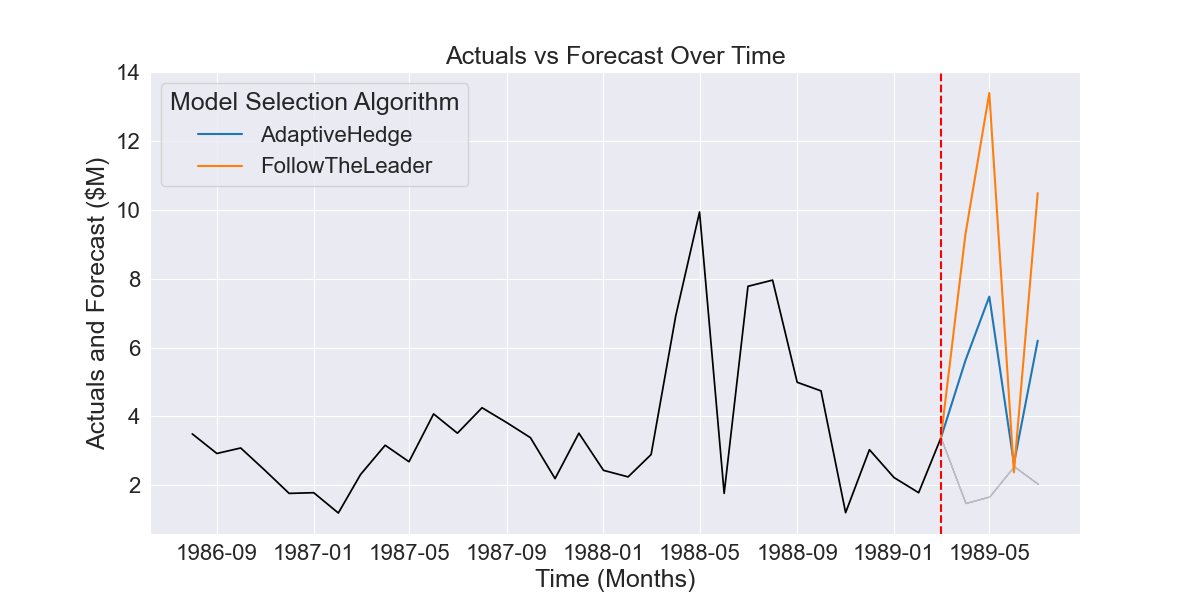
Fig 2.2.6 FollowTheLeader vs AdaptiveHedge forecast for period shown in Fig 2.2.1, with AdaptiveHedge having dramatically lower error
Conclusion
The two articles have shown both the role that AdaptiveHedge can play in automating model selection and the improvement it can bring over a non-ensembling method like AdaptiveHedge. In future, I intend to write about the design of backtestForecaster, an API for automated time-series forecasting and model selection, as well as about a method for statistical validation of experimental results using a further nested layer of time-series cross validation.